Large area mapping of symmetric and asymmetric cells
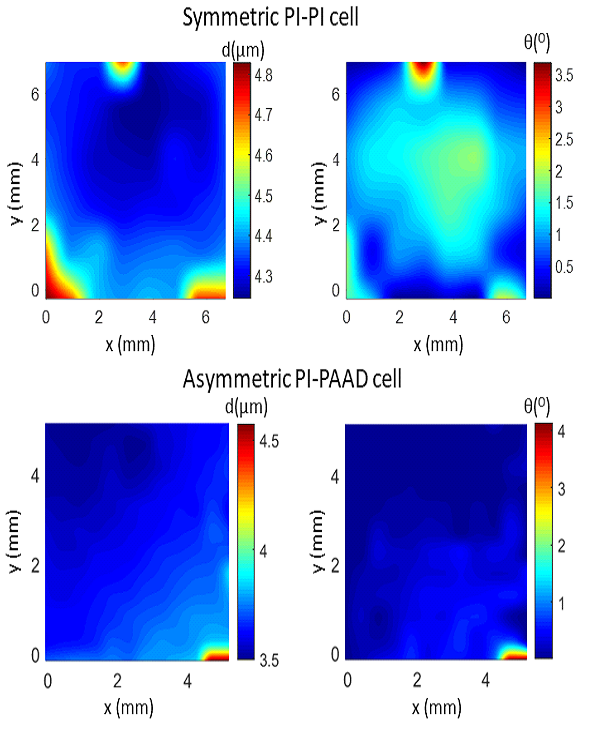
OMPA is capable of characterising the thickness, uniformity and alignment quality over a large area of a liquid crystal cell. This can be done for cells with symmetric and asymmetric design, where two substrates have different alignment layers. The figures shown demonstrate the measurement of the cell thickness and the pretilt angle in a symmetric cell containing two PI alignment layers and an asymmetric cell containing PI and azobenzene based photoalignment PAAD layers.
Mapping cell thickness and pretilt angles
When liquid crystal devices and displays are produced on an industrial scale, their uniformity and quality of alignment is checked with specialised equipment. However, R&D in liquid crystals often involves exploring new cell design, new liquid crystals, substrates, aligning layers or electrode geometries. The successful development of such prototypes requires compact and fast method to characterise the whole area of liquid crystal cells that are in the early stages of development.
A simple but reliable characterisation technique becomes more difficult for device prototypes with complex designs. Some new liquid crystal devices have an asymmetric structure, where the liquid crystal layer is in contact with substrates that are made of different materials or have different alignment layers deposited on them. It is not straightforward to characterise such cells with standards methods.
We have developed a numerical model and fitting algorithms that can analyse symmetric and asymmetric cells, measuring the pretilt angle and the anchoring energy. The OMPA capability to characterise symmetric and asymmetric cells is demonstrated in the two examples on the right. As a symmetric cell, we chose a cell consisting of a nematic liquid crystal layer (E7) between two glass substrates coated with ITO conductive layers and with rubbed polyimide (PI). For reliability, the asymmetric cell also contains a nematic E7 layer and rubbed PI as one of the alignment layers. The other alignment layer was a photo-aligning azobenzene dye (PAAD-22D) provided by the Beam Co.
The figures show maps of the cell thickness for both symmetric and asymmetric cells. The maps of the pretilt angle show the liquid crystal alignment on the rubbed PI layer in the symmetric cell and on the photoalignment PAAD layer in the asymmetric cell. The maps show that the rubbed polyimide produces a pretilt angle around 1-2o. The photoalignment PAAD layer aligns liquid crystal with a pretilt angle less than 1o. Both cells have good quality alignment across the whole cell area, except at a few defective points where the pretilt is large.
Measuring the anchoring energy in liquid crystal cells
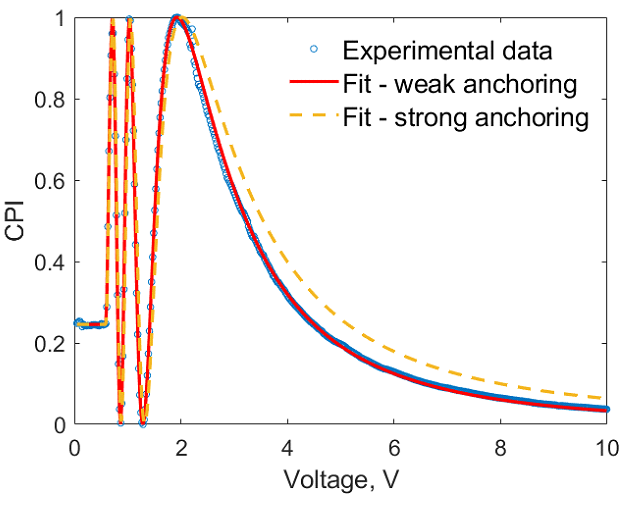
OMPA can estimate the anchoring energy in a liquid crystal cell. The figure on the left shows best-fit curves for a cell containing a layer of LC QYTN between two layers of P3HT. The best quality fit was obtained using an anchoring energy of 2×10⁻⁴ J/m2.
Details: anchoring energy measurement
Measuring the anchoring energy of liquid crystals on alignment layers is not trivial, as it often requires a complicated experimental set up and specially designed liquid crystal cells. OMPA provides a quick evaluation of the anchoring energy: it detects if the anchoring is strong or weak, and, in the case of weak anchoring, evaluates its strength.
Evaluating anchoring energy with OMPA is straightforward. It does not require any additional liquid crystal samples. Moreover, the evaluation of the anchoring energy does not require any additional measurement steps, as it is a part of fitting algorithm that analyses the data used to find other liquid crystal parameters, such as elastic constants, cell thickness and pretilt.
For demonstration, we selected a liquid crystal cell containing a layer of LC QYTN between two layers of P3HT. From our previous experience we knew that P3HT induced planar alignment of the liquid crystal, but the anchoring strength was unknown. The figure on the left shows an experimental crossed-polarised intensity trace (cyan circles) and two best-fit curves, one assuming that the anchoring is infinitely strong and one using the anchoring energy as a fitting parameter. Only the latter case gives a good fit providing an estimate of the anchoring energy of 2×10⁻⁴ J/m2.
Full characterization of liquid crystals and doped liquid crystal suspensions
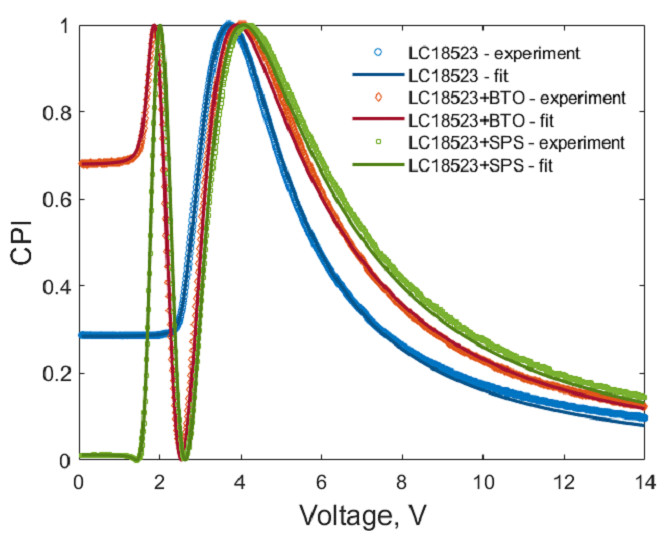
OMPA can provide a full characterisation of nematic liquid crystals including complex and non-standard liquid crystal systems, for example liquid crystal based colloidal suspensions of nanoparticles. We have successfully characterised nematic liquid crystal (LC 18523) and liquid crystals doped with 1%wt BaTiO3 (BTO) and 1% Sn2P2S6 (SPS) nanoparticles, capturing their elastic constants, viscosity, pretilt and anchoring energy. The figure on the right demonstrates the fitting of optical cross-polarized intensity traces for the doped nematic.
Comprehensive characterisation of undoped and doped liquid crystal parameters
OMPA can provide a full characterisation of not only standard nematic but also more complex and non-standard liquid crystal systems, for example liquid crystal based colloidal suspensions of nanoparticles. Doping liquid crystals at a concentration of just a few percent does not affect the optical quality of liquid crystals, but can significantly enhance their properties, for example increase their electro-optic response or nonlinear response, reduce their voltage threshold or increase their birefringence. Thus a technique for full characterisation of doped liquid crystals is of a great interest to many research groups.
The interest in doped liquid crystals continues and it has recently been suggested that the nanoparticles can sweep out the ions from liquid crystal host. The presence of ions, with different dynamics, has significant effect on the performance of liquid crystals in displays and modulators. Being able to quickly evaluate the performance of such systems is essential to determine their suitability for R&D.
We demonstrate here a successful application of OMPA for characterisation of standard nematic and liquid crystals dopes with ferroelectric nanoparticles. We investigated two mixtures: LC18523 with 1%wt. of BaTiO3 (BTO) (nanoparticle size 15 nm) and LC18523 with 1%wt. of Sn2P2S6 (SPS) (nanoparticle size 50 nm). Both types of nanoparticles were prepared by milling micron sized particles together with a surfactant (oleic acid) and transferred to the LC through an intermediate solvent. Planar cells with good quality were used for OMPA measurements. The figure on the right displays cross-polarised intensity measurements for pure and doped LC18523 highlighting that it is possible to obtain good quality fits for both.
Temperature dependence of liquid crystal viscosities
OMPA can characterise liquid crystal properties for a wide range of temperatures, as it is equipped with a temperature controlled sample holder. We demonstrate this by measuring the dependence of the E7 rotational viscosity on temperature.
Characterising viscosity and its dependence on temperature
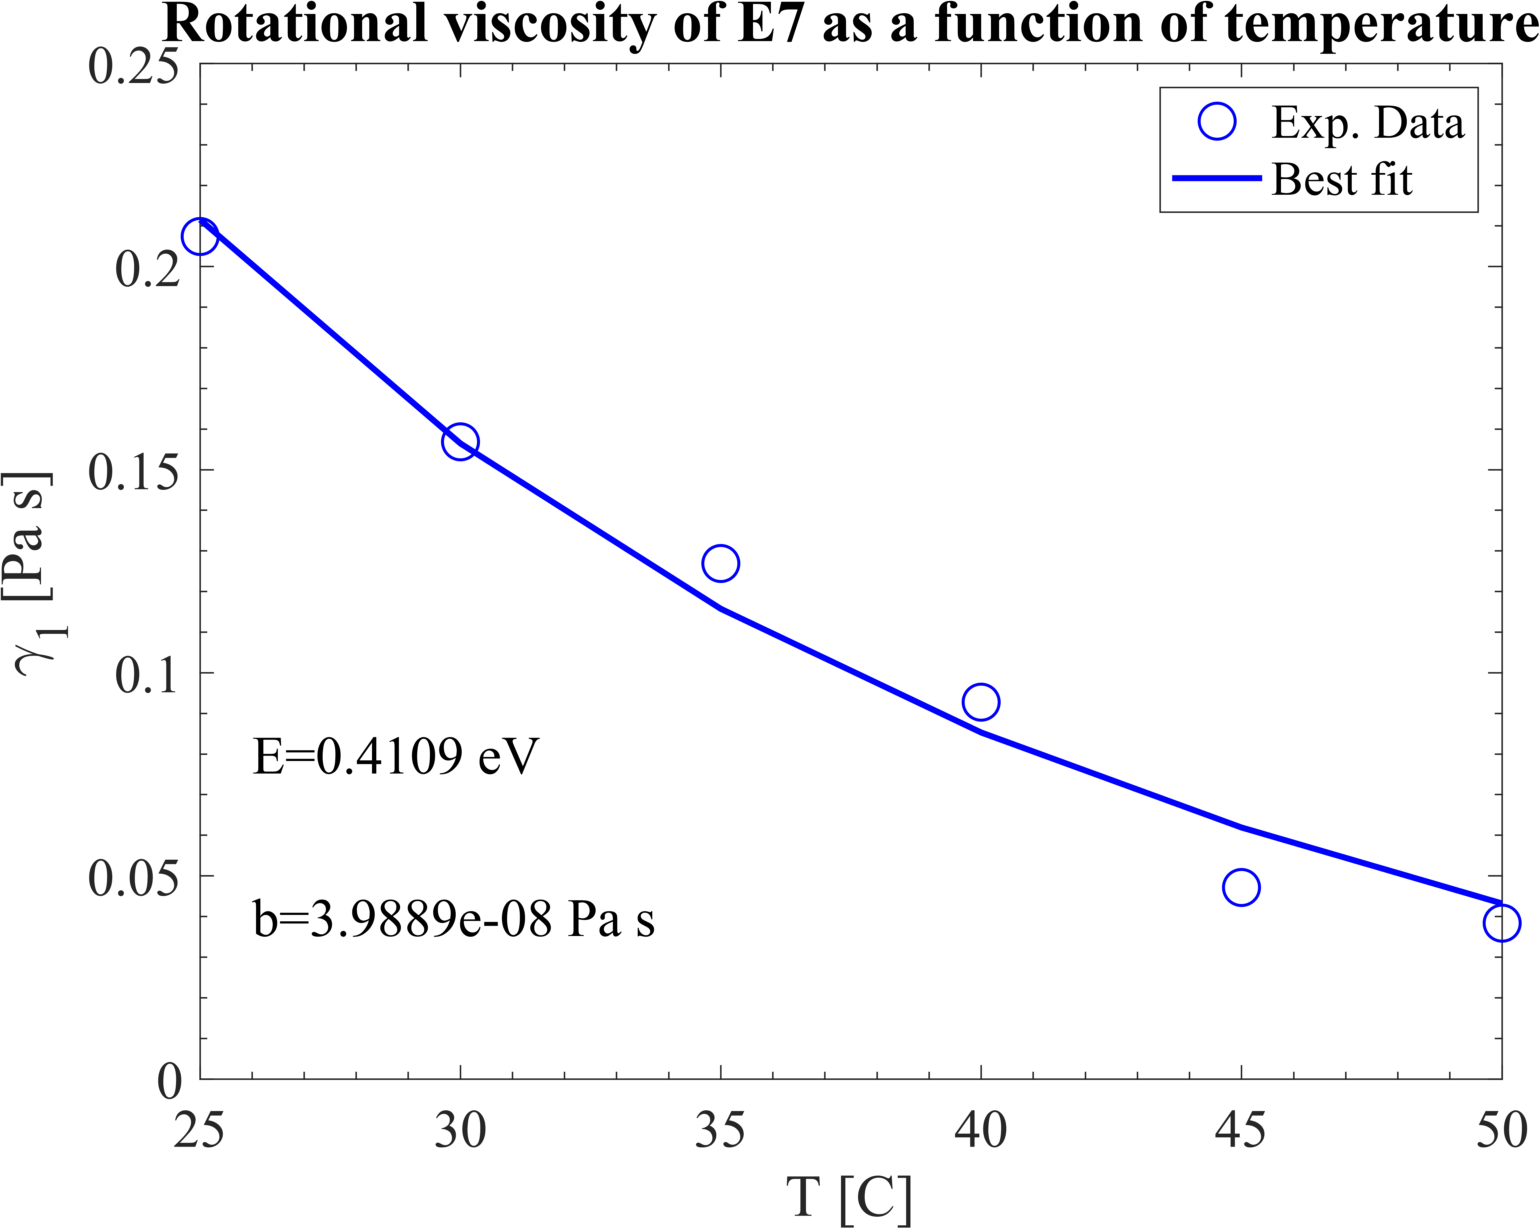
The viscosity of liquid crystals is critical for assessing the speed of their response to driving voltage. This defines the refreshing rate of liquid crystal displays, switches and modulators. Viscosity, just as other liquid crystal parameters, is temperature dependent. For technological applications, it is crucial to know the liquid crystal viscosity for the full range of device operation temperatures. In this case study we demonstrate that OMPA can measure the liquid crystal viscosity in a practical temperature range.
For a demonstration purpose, we selected a widely used and well characterised liquid crystal E7. The rotational viscosity was measured in a temperature range between 25oC and 50oC, as demonstrated in the following summary plot, accompanied by a fitting function.